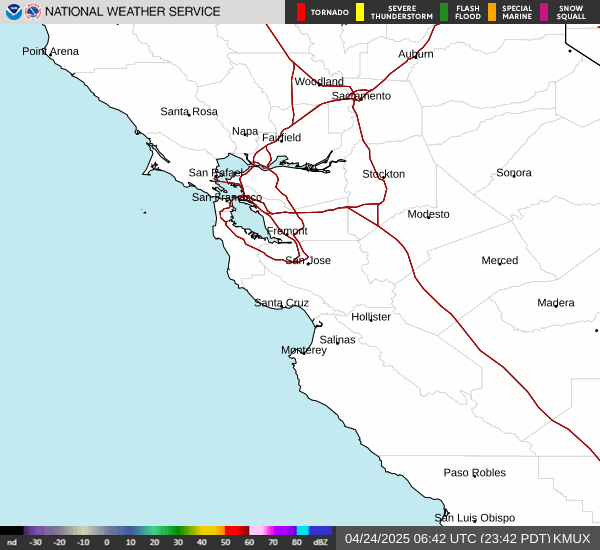
Daily / Monthly Weather History From This Station
Daily Report for the month of April 2025
Apr 1 Average and Extremes |
Average temperature | 52.9�F |
Average humidity | 77% |
Average dewpoint | 45.8�F |
Average barometer | 29.9 in. |
Average windspeed | 6.9 mph |
Average gustspeed | 10.5 mph |
Average direction | 259� ( W ) |
Rainfall for month | 0.14 in. |
Rainfall for year | 9.81 in. |
Maximum rain per minute | 0.02 in. on day 01 at time 09:22 |
Maximum temperature | 58.2�F on day 01 at time 12:40 |
Minimum temperature | 47.9�F on day 01 at time 02:35 |
Maximum humidity | 89% on day 01 at time 06:29 |
Minimum humidity | 64% on day 01 at time 16:12 |
Maximum pressure | 29.991 in. on day 01 at time 00:01 |
Minimum pressure | 29.860 in. on day 01 at time 23:14 |
Maximum windspeed | 17.3 mph on day 01 at time 17:47 |
Maximum gust speed | 26.5 mph from 259 �( W ) on day 01 at time 16:40 |
Maximum heat index | 58.2�F on day 01 at time 12:40 |
Click here to toggle the 24 Hour Graph of this day
Apr 2 Average and Extremes |
Average temperature | 52.5�F |
Average humidity | 71% |
Average dewpoint | 43.1�F |
Average barometer | 29.9 in. |
Average windspeed | 4.9 mph |
Average gustspeed | 7.6 mph |
Average direction | 262� ( W ) |
Rainfall for month | 0.14 in. |
Rainfall for year | 9.81 in. |
Maximum rain per minute | 0.00 in. on day 02 at time 23:59 |
Maximum temperature | 60.4�F on day 02 at time 14:54 |
Minimum temperature | 43.3�F on day 02 at time 07:18 |
Maximum humidity | 83% on day 02 at time 07:36 |
Minimum humidity | 55% on day 02 at time 13:54 |
Maximum pressure | 29.906 in. on day 02 at time 10:59 |
Minimum pressure | 29.829 in. on day 02 at time 18:14 |
Maximum windspeed | 15.0 mph on day 02 at time 18:31 |
Maximum gust speed | 23.0 mph from 283 �(WNW) on day 02 at time 18:34 |
Maximum heat index | 60.4�F on day 02 at time 14:54 |
Click here to toggle the 24 Hour Graph of this day
Apr 3 Average and Extremes |
Average temperature | 54.5�F |
Average humidity | 70% |
Average dewpoint | 44.8�F |
Average barometer | 29.9 in. |
Average windspeed | 3.5 mph |
Average gustspeed | 5.6 mph |
Average direction | 248� (WSW) |
Rainfall for month | 0.14 in. |
Rainfall for year | 9.81 in. |
Maximum rain per minute | 0.00 in. on day 03 at time 23:59 |
Maximum temperature | 63.9�F on day 03 at time 14:25 |
Minimum temperature | 44.4�F on day 03 at time 07:15 |
Maximum humidity | 84% on day 03 at time 07:38 |
Minimum humidity | 44% on day 03 at time 14:36 |
Maximum pressure | 30.039 in. on day 03 at time 23:59 |
Minimum pressure | 29.890 in. on day 03 at time 05:29 |
Maximum windspeed | 12.7 mph on day 03 at time 17:48 |
Maximum gust speed | 19.6 mph from 240 �(WSW) on day 03 at time 17:10 |
Maximum heat index | 63.9�F on day 03 at time 14:25 |
Click here to toggle the 24 Hour Graph of this day
Apr 4 Average and Extremes |
Average temperature | 56.9�F |
Average humidity | 70% |
Average dewpoint | 46.3�F |
Average barometer | 30.1 in. |
Average windspeed | 3.0 mph |
Average gustspeed | 4.8 mph |
Average direction | 256� (WSW) |
Rainfall for month | 0.14 in. |
Rainfall for year | 9.81 in. |
Maximum rain per minute | 0.00 in. on day 04 at time 23:59 |
Maximum temperature | 71.5�F on day 04 at time 15:22 |
Minimum temperature | 44.1�F on day 04 at time 07:15 |
Maximum humidity | 87% on day 04 at time 07:45 |
Minimum humidity | 37% on day 04 at time 15:20 |
Maximum pressure | 30.197 in. on day 04 at time 23:59 |
Minimum pressure | 30.044 in. on day 04 at time 00:00 |
Maximum windspeed | 13.8 mph on day 04 at time 17:31 |
Maximum gust speed | 19.6 mph from 257 �(WSW) on day 04 at time 18:08 |
Maximum heat index | 77.4�F on day 04 at time 14:22 |
Click here to toggle the 24 Hour Graph of this day
Apr 5 Average and Extremes |
Average temperature | 59.2�F |
Average humidity | 67% |
Average dewpoint | 47.4�F |
Average barometer | 30.2 in. |
Average windspeed | 2.5 mph |
Average gustspeed | 4.0 mph |
Average direction | 257� (WSW) |
Rainfall for month | 0.14 in. |
Rainfall for year | 9.81 in. |
Maximum rain per minute | 0.00 in. on day 05 at time 23:59 |
Maximum temperature | 72.0�F on day 05 at time 15:17 |
Minimum temperature | 48.7�F on day 05 at time 06:47 |
Maximum humidity | 84% on day 05 at time 07:34 |
Minimum humidity | 37% on day 05 at time 17:52 |
Maximum pressure | 30.252 in. on day 05 at time 10:59 |
Minimum pressure | 30.186 in. on day 05 at time 02:29 |
Maximum windspeed | 11.5 mph on day 05 at time 16:55 |
Maximum gust speed | 17.3 mph from 280 �( W ) on day 05 at time 16:53 |
Maximum heat index | 77.5�F on day 05 at time 18:17 |
Click here to toggle the 24 Hour Graph of this day
Apr 6 Average and Extremes |
Average temperature | 58.5�F |
Average humidity | 66% |
Average dewpoint | 45.6�F |
Average barometer | 30.2 in. |
Average windspeed | 2.0 mph |
Average gustspeed | 3.4 mph |
Average direction | 271� ( W ) |
Rainfall for month | 0.14 in. |
Rainfall for year | 9.81 in. |
Maximum rain per minute | 0.00 in. on day 06 at time 23:59 |
Maximum temperature | 71.6�F on day 06 at time 15:09 |
Minimum temperature | 46.3�F on day 06 at time 06:47 |
Maximum humidity | 90% on day 06 at time 07:44 |
Minimum humidity | 28% on day 06 at time 17:25 |
Maximum pressure | 30.231 in. on day 06 at time 00:14 |
Minimum pressure | 30.104 in. on day 06 at time 19:59 |
Maximum windspeed | 11.5 mph on day 06 at time 15:32 |
Maximum gust speed | 18.4 mph from 253 �(WSW) on day 06 at time 13:39 |
Maximum heat index | 77.4�F on day 06 at time 16:04 |
Click here to toggle the 24 Hour Graph of this day
Apr 7 Average and Extremes |
Average temperature | 59.6�F |
Average humidity | 73% |
Average dewpoint | 50.9�F |
Average barometer | 30.1 in. |
Average windspeed | 2.8 mph |
Average gustspeed | 4.7 mph |
Average direction | 273� ( W ) |
Rainfall for month | 0.14 in. |
Rainfall for year | 9.81 in. |
Maximum rain per minute | 0.00 in. on day 07 at time 23:59 |
Maximum temperature | 65.4�F on day 07 at time 14:45 |
Minimum temperature | 55.1�F on day 07 at time 23:52 |
Maximum humidity | 84% on day 07 at time 23:36 |
Minimum humidity | 60% on day 07 at time 09:39 |
Maximum pressure | 30.139 in. on day 07 at time 00:29 |
Minimum pressure | 30.077 in. on day 07 at time 06:29 |
Maximum windspeed | 11.5 mph on day 07 at time 17:57 |
Maximum gust speed | 17.3 mph from 296 �(WNW) on day 07 at time 17:57 |
Maximum heat index | 65.4�F on day 07 at time 14:45 |
Click here to toggle the 24 Hour Graph of this day
Apr 8 Average and Extremes |
Average temperature | 59.2�F |
Average humidity | 73% |
Average dewpoint | 50.3�F |
Average barometer | 30.1 in. |
Average windspeed | 3.3 mph |
Average gustspeed | 5.5 mph |
Average direction | 267� ( W ) |
Rainfall for month | 0.14 in. |
Rainfall for year | 9.81 in. |
Maximum rain per minute | 0.00 in. on day 08 at time 23:59 |
Maximum temperature | 68.6�F on day 08 at time 15:46 |
Minimum temperature | 52.2�F on day 08 at time 06:57 |
Maximum humidity | 86% on day 08 at time 07:46 |
Minimum humidity | 56% on day 08 at time 15:48 |
Maximum pressure | 30.139 in. on day 08 at time 11:14 |
Minimum pressure | 30.047 in. on day 08 at time 18:29 |
Maximum windspeed | 12.7 mph on day 08 at time 16:12 |
Maximum gust speed | 19.6 mph from 254 �(WSW) on day 08 at time 16:19 |
Maximum heat index | 76.6�F on day 08 at time 15:48 |
Click here to toggle the 24 Hour Graph of this day
Apr 9 Average and Extremes |
Average temperature | 61.1�F |
Average humidity | 72% |
Average dewpoint | 51.7�F |
Average barometer | 30.1 in. |
Average windspeed | 2.8 mph |
Average gustspeed | 4.5 mph |
Average direction | 267� ( W ) |
Rainfall for month | 0.14 in. |
Rainfall for year | 9.81 in. |
Maximum rain per minute | 0.00 in. on day 09 at time 23:59 |
Maximum temperature | 74.9�F on day 09 at time 16:11 |
Minimum temperature | 48.9�F on day 09 at time 06:34 |
Maximum humidity | 85% on day 09 at time 07:32 |
Minimum humidity | 52% on day 09 at time 15:25 |
Maximum pressure | 30.110 in. on day 09 at time 11:14 |
Minimum pressure | 30.040 in. on day 09 at time 18:59 |
Maximum windspeed | 12.7 mph on day 09 at time 15:14 |
Maximum gust speed | 17.3 mph from 307 �( NW) on day 09 at time 17:29 |
Maximum heat index | 77.5�F on day 09 at time 16:11 |
Click here to toggle the 24 Hour Graph of this day
Apr 10 Average and Extremes |
Average temperature | 60.0�F |
Average humidity | 76% |
Average dewpoint | 52.2�F |
Average barometer | 30.1 in. |
Average windspeed | 3.5 mph |
Average gustspeed | 5.4 mph |
Average direction | 264� ( W ) |
Rainfall for month | 0.14 in. |
Rainfall for year | 9.81 in. |
Maximum rain per minute | 0.00 in. on day 10 at time 23:59 |
Maximum temperature | 69.0�F on day 10 at time 16:12 |
Minimum temperature | 53.2�F on day 10 at time 05:57 |
Maximum humidity | 87% on day 10 at time 08:05 |
Minimum humidity | 55% on day 10 at time 13:28 |
Maximum pressure | 30.201 in. on day 10 at time 11:29 |
Minimum pressure | 30.094 in. on day 10 at time 05:14 |
Maximum windspeed | 12.7 mph on day 10 at time 17:03 |
Maximum gust speed | 18.4 mph from 243 �(WSW) on day 10 at time 14:51 |
Maximum heat index | 76.8�F on day 10 at time 13:23 |
Click here to toggle the 24 Hour Graph of this day
Apr 11 Average and Extremes |
Average temperature | 58.9�F |
Average humidity | 79% |
Average dewpoint | 52.2�F |
Average barometer | 30.1 in. |
Average windspeed | 4.4 mph |
Average gustspeed | 6.9 mph |
Average direction | 262� ( W ) |
Rainfall for month | 0.14 in. |
Rainfall for year | 9.81 in. |
Maximum rain per minute | 0.00 in. on day 11 at time 23:59 |
Maximum temperature | 67.8�F on day 11 at time 12:51 |
Minimum temperature | 53.7�F on day 11 at time 23:59 |
Maximum humidity | 87% on day 11 at time 07:19 |
Minimum humidity | 66% on day 11 at time 12:50 |
Maximum pressure | 30.128 in. on day 11 at time 00:00 |
Minimum pressure | 30.007 in. on day 11 at time 20:29 |
Maximum windspeed | 15.0 mph on day 11 at time 15:53 |
Maximum gust speed | 21.9 mph from 261 �( W ) on day 11 at time 15:39 |
Maximum heat index | 67.8�F on day 11 at time 12:49 |
Click here to toggle the 24 Hour Graph of this day
Apr 12 Average and Extremes |
Average temperature | 56.0�F |
Average humidity | 71% |
Average dewpoint | 46.5�F |
Average barometer | 30.0 in. |
Average windspeed | 4.4 mph |
Average gustspeed | 6.9 mph |
Average direction | 263� ( W ) |
Rainfall for month | 0.14 in. |
Rainfall for year | 9.81 in. |
Maximum rain per minute | 0.00 in. on day 12 at time 23:59 |
Maximum temperature | 64.0�F on day 12 at time 16:50 |
Minimum temperature | 49.4�F on day 12 at time 07:08 |
Maximum humidity | 80% on day 12 at time 23:59 |
Minimum humidity | 55% on day 12 at time 17:04 |
Maximum pressure | 30.029 in. on day 12 at time 00:44 |
Minimum pressure | 29.925 in. on day 12 at time 19:44 |
Maximum windspeed | 11.5 mph on day 12 at time 18:46 |
Maximum gust speed | 16.1 mph from 274 �( W ) on day 12 at time 18:46 |
Maximum heat index | 64.0�F on day 12 at time 16:50 |
Click here to toggle the 24 Hour Graph of this day
Apr 13 Average and Extremes |
Average temperature | 60.7�F |
Average humidity | 65% |
Average dewpoint | 47.5�F |
Average barometer | 29.9 in. |
Average windspeed | 2.3 mph |
Average gustspeed | 3.7 mph |
Average direction | 265� ( W ) |
Rainfall for month | 0.14 in. |
Rainfall for year | 9.81 in. |
Maximum rain per minute | 0.00 in. on day 13 at time 23:59 |
Maximum temperature | 78.2�F on day 13 at time 16:51 |
Minimum temperature | 45.9�F on day 13 at time 06:57 |
Maximum humidity | 84% on day 13 at time 07:33 |
Minimum humidity | 34% on day 13 at time 16:36 |
Maximum pressure | 29.940 in. on day 13 at time 11:14 |
Minimum pressure | 29.839 in. on day 13 at time 16:59 |
Maximum windspeed | 10.4 mph on day 13 at time 18:06 |
Maximum gust speed | 15.0 mph from 279 �( W ) on day 13 at time 17:08 |
Maximum heat index | 78.6�F on day 13 at time 16:50 |
Click here to toggle the 24 Hour Graph of this day
Apr 14 Average and Extremes |
Average temperature | 60.8�F |
Average humidity | 70% |
Average dewpoint | 50.4�F |
Average barometer | 29.9 in. |
Average windspeed | 2.7 mph |
Average gustspeed | 4.5 mph |
Average direction | 268� ( W ) |
Rainfall for month | 0.14 in. |
Rainfall for year | 9.81 in. |
Maximum rain per minute | 0.00 in. on day 14 at time 23:59 |
Maximum temperature | 74.0�F on day 14 at time 14:16 |
Minimum temperature | 51.1�F on day 14 at time 06:24 |
Maximum humidity | 85% on day 14 at time 23:43 |
Minimum humidity | 44% on day 14 at time 13:38 |
Maximum pressure | 29.941 in. on day 14 at time 22:44 |
Minimum pressure | 29.848 in. on day 14 at time 05:44 |
Maximum windspeed | 11.5 mph on day 14 at time 15:10 |
Maximum gust speed | 17.3 mph from 259 �( W ) on day 14 at time 14:51 |
Maximum heat index | 77.3�F on day 14 at time 14:15 |
Click here to toggle the 24 Hour Graph of this day
Apr 15 Average and Extremes |
Average temperature | 58.9�F |
Average humidity | 73% |
Average dewpoint | 50.2�F |
Average barometer | 29.9 in. |
Average windspeed | 4.0 mph |
Average gustspeed | 6.5 mph |
Average direction | 263� ( W ) |
Rainfall for month | 0.14 in. |
Rainfall for year | 9.81 in. |
Maximum rain per minute | 0.00 in. on day 15 at time 23:59 |
Maximum temperature | 65.0�F on day 15 at time 13:56 |
Minimum temperature | 55.5�F on day 15 at time 00:54 |
Maximum humidity | 82% on day 15 at time 05:02 |
Minimum humidity | 61% on day 15 at time 16:31 |
Maximum pressure | 29.988 in. on day 15 at time 11:14 |
Minimum pressure | 29.900 in. on day 15 at time 17:59 |
Maximum windspeed | 13.8 mph on day 15 at time 16:51 |
Maximum gust speed | 19.6 mph from 290 �(WNW) on day 15 at time 16:50 |
Maximum heat index | 65.0�F on day 15 at time 13:56 |
Click here to toggle the 24 Hour Graph of this day
Apr 16 Average and Extremes |
Average temperature | 58.0�F |
Average humidity | 73% |
Average dewpoint | 49.4�F |
Average barometer | 29.9 in. |
Average windspeed | 4.8 mph |
Average gustspeed | 7.5 mph |
Average direction | 264� ( W ) |
Rainfall for month | 0.14 in. |
Rainfall for year | 9.81 in. |
Maximum rain per minute | 0.00 in. on day 16 at time 23:59 |
Maximum temperature | 64.3�F on day 16 at time 15:35 |
Minimum temperature | 50.7�F on day 16 at time 06:38 |
Maximum humidity | 84% on day 16 at time 07:22 |
Minimum humidity | 63% on day 16 at time 16:03 |
Maximum pressure | 29.937 in. on day 16 at time 00:59 |
Minimum pressure | 29.863 in. on day 16 at time 18:59 |
Maximum windspeed | 13.8 mph on day 16 at time 16:49 |
Maximum gust speed | 20.7 mph from 307 �( NW) on day 16 at time 14:55 |
Maximum heat index | 64.3�F on day 16 at time 15:35 |
Click here to toggle the 24 Hour Graph of this day
Apr 17 Average and Extremes |
Average temperature | 57.7�F |
Average humidity | 74% |
Average dewpoint | 49.4�F |
Average barometer | 29.9 in. |
Average windspeed | 3.7 mph |
Average gustspeed | 5.8 mph |
Average direction | 252� (WSW) |
Rainfall for month | 0.14 in. |
Rainfall for year | 9.81 in. |
Maximum rain per minute | 0.00 in. on day 17 at time 23:59 |
Maximum temperature | 62.3�F on day 17 at time 17:24 |
Minimum temperature | 54.6�F on day 17 at time 23:19 |
Maximum humidity | 84% on day 17 at time 08:39 |
Minimum humidity | 66% on day 17 at time 18:27 |
Maximum pressure | 29.932 in. on day 17 at time 23:59 |
Minimum pressure | 29.868 in. on day 17 at time 04:44 |
Maximum windspeed | 10.4 mph on day 17 at time 14:27 |
Maximum gust speed | 13.8 mph from 254 �(WSW) on day 17 at time 14:58 |
Maximum heat index | 62.3�F on day 17 at time 17:24 |
Click here to toggle the 24 Hour Graph of this day
Apr 18 Average and Extremes |
Average temperature | 57.4�F |
Average humidity | 76% |
Average dewpoint | 49.9�F |
Average barometer | 30.0 in. |
Average windspeed | 3.5 mph |
Average gustspeed | 5.6 mph |
Average direction | 267� ( W ) |
Rainfall for month | 0.14 in. |
Rainfall for year | 9.81 in. |
Maximum rain per minute | 0.00 in. on day 18 at time 23:59 |
Maximum temperature | 66.0�F on day 18 at time 15:45 |
Minimum temperature | 53.5�F on day 18 at time 23:59 |
Maximum humidity | 85% on day 18 at time 23:59 |
Minimum humidity | 64% on day 18 at time 15:04 |
Maximum pressure | 29.994 in. on day 18 at time 10:59 |
Minimum pressure | 29.918 in. on day 18 at time 04:59 |
Maximum windspeed | 11.5 mph on day 18 at time 17:02 |
Maximum gust speed | 19.6 mph from 267 �( W ) on day 18 at time 16:53 |
Maximum heat index | 66.0�F on day 18 at time 15:45 |
Click here to toggle the 24 Hour Graph of this day
Apr 19 Average and Extremes |
Average temperature | 56.7�F |
Average humidity | 77% |
Average dewpoint | 49.5�F |
Average barometer | 30.1 in. |
Average windspeed | 2.9 mph |
Average gustspeed | 4.9 mph |
Average direction | 271� ( W ) |
Rainfall for month | 0.14 in. |
Rainfall for year | 9.81 in. |
Maximum rain per minute | 0.00 in. on day 19 at time 23:59 |
Maximum temperature | 66.0�F on day 19 at time 15:17 |
Minimum temperature | 49.8�F on day 19 at time 02:51 |
Maximum humidity | 87% on day 19 at time 04:36 |
Minimum humidity | 64% on day 19 at time 15:28 |
Maximum pressure | 30.101 in. on day 19 at time 11:14 |
Minimum pressure | 29.990 in. on day 19 at time 02:29 |
Maximum windspeed | 11.5 mph on day 19 at time 18:05 |
Maximum gust speed | 17.3 mph from 287 �(WNW) on day 19 at time 18:05 |
Maximum heat index | 66.0�F on day 19 at time 15:17 |
Click here to toggle the 24 Hour Graph of this day
Apr 20 Average and Extremes |
Average temperature | 58.5�F |
Average humidity | 74% |
Average dewpoint | 49.9�F |
Average barometer | 30.0 in. |
Average windspeed | 3.0 mph |
Average gustspeed | 5.1 mph |
Average direction | 272� ( W ) |
Rainfall for month | 0.14 in. |
Rainfall for year | 9.81 in. |
Maximum rain per minute | 0.00 in. on day 20 at time 23:59 |
Maximum temperature | 68.7�F on day 20 at time 15:23 |
Minimum temperature | 52.4�F on day 20 at time 23:59 |
Maximum humidity | 84% on day 20 at time 23:59 |
Minimum humidity | 58% on day 20 at time 17:44 |
Maximum pressure | 30.079 in. on day 20 at time 00:29 |
Minimum pressure | 29.955 in. on day 20 at time 19:44 |
Maximum windspeed | 11.5 mph on day 20 at time 15:32 |
Maximum gust speed | 16.1 mph from 254 �(WSW) on day 20 at time 16:00 |
Maximum heat index | 76.4�F on day 20 at time 14:26 |
Click here to toggle the 24 Hour Graph of this day
Apr 21 Average and Extremes |
Average temperature | 60.4�F |
Average humidity | 75% |
Average dewpoint | 51.8�F |
Average barometer | 29.9 in. |
Average windspeed | 2.6 mph |
Average gustspeed | 4.2 mph |
Average direction | 263� ( W ) |
Rainfall for month | 0.14 in. |
Rainfall for year | 9.81 in. |
Maximum rain per minute | 0.00 in. on day 21 at time 23:59 |
Maximum temperature | 75.0�F on day 21 at time 16:31 |
Minimum temperature | 48.0�F on day 21 at time 04:37 |
Maximum humidity | 91% on day 21 at time 05:31 |
Minimum humidity | 51% on day 21 at time 14:43 |
Maximum pressure | 29.982 in. on day 21 at time 00:00 |
Minimum pressure | 29.848 in. on day 21 at time 18:44 |
Maximum windspeed | 10.4 mph on day 21 at time 18:02 |
Maximum gust speed | 16.1 mph from 250 �(WSW) on day 21 at time 17:35 |
Maximum heat index | 77.5�F on day 21 at time 16:31 |
Click here to toggle the 24 Hour Graph of this day
Apr 22 Average and Extremes |
Average temperature | 59.0�F |
Average humidity | 76% |
Average dewpoint | 51.0�F |
Average barometer | 29.9 in. |
Average windspeed | 3.1 mph |
Average gustspeed | 5.0 mph |
Average direction | 269� ( W ) |
Rainfall for month | 0.14 in. |
Rainfall for year | 9.81 in. |
Maximum rain per minute | 0.00 in. on day 22 at time 23:59 |
Maximum temperature | 68.7�F on day 22 at time 15:54 |
Minimum temperature | 52.3�F on day 22 at time 05:47 |
Maximum humidity | 87% on day 22 at time 08:21 |
Minimum humidity | 60% on day 22 at time 18:42 |
Maximum pressure | 29.900 in. on day 22 at time 00:44 |
Minimum pressure | 29.833 in. on day 22 at time 17:29 |
Maximum windspeed | 11.5 mph on day 22 at time 18:12 |
Maximum gust speed | 17.3 mph from 265 �( W ) on day 22 at time 18:28 |
Maximum heat index | 75.9�F on day 22 at time 15:57 |
Click here to toggle the 24 Hour Graph of this day
Apr 23 Average and Extremes |
Average temperature | 54.9�F |
Average humidity | 74% |
Average dewpoint | 46.7�F |
Average barometer | 29.9 in. |
Average windspeed | 5.7 mph |
Average gustspeed | 8.8 mph |
Average direction | 254� (WSW) |
Rainfall for month | 0.14 in. |
Rainfall for year | 9.81 in. |
Maximum rain per minute | 0.00 in. on day 23 at time 23:59 |
Maximum temperature | 60.6�F on day 23 at time 14:50 |
Minimum temperature | 51.7�F on day 23 at time 05:56 |
Maximum humidity | 79% on day 23 at time 06:26 |
Minimum humidity | 65% on day 23 at time 14:48 |
Maximum pressure | 29.974 in. on day 23 at time 23:44 |
Minimum pressure | 29.867 in. on day 23 at time 05:14 |
Maximum windspeed | 12.7 mph on day 23 at time 16:23 |
Maximum gust speed | 18.4 mph from 279 �( W ) on day 23 at time 16:14 |
Maximum heat index | 60.6�F on day 23 at time 14:50 |
Click here to toggle the 24 Hour Graph of this day
Apr 24 Average and Extremes |
Average temperature | 54.2�F |
Average humidity | 72% |
Average dewpoint | 45.6�F |
Average barometer | 29.9 in. |
Average windspeed | 5.5 mph |
Average gustspeed | 8.4 mph |
Average direction | 254� (WSW) |
Rainfall for month | 0.14 in. |
Rainfall for year | 9.81 in. |
Maximum rain per minute | 0.00 in. on day 24 at time 23:59 |
Maximum temperature | 56.5�F on day 24 at time 17:43 |
Minimum temperature | 52.6�F on day 24 at time 05:56 |
Maximum humidity | 78% on day 24 at time 05:56 |
Minimum humidity | 65% on day 24 at time 17:45 |
Maximum pressure | 29.993 in. on day 24 at time 11:14 |
Minimum pressure | 29.894 in. on day 24 at time 20:14 |
Maximum windspeed | 11.5 mph on day 24 at time 18:28 |
Maximum gust speed | 16.1 mph from 302 �(WNW) on day 24 at time 20:51 |
Maximum heat index | 56.5�F on day 24 at time 17:43 |
Click here to toggle the 24 Hour Graph of this day
Apr 25 Average and Extremes |
Average temperature | 54.8�F |
Average humidity | 71% |
Average dewpoint | 45.5�F |
Average barometer | 29.9 in. |
Average windspeed | 3.1 mph |
Average gustspeed | 4.7 mph |
Average direction | 251� (WSW) |
Rainfall for month | 0.14 in. |
Rainfall for year | 9.81 in. |
Maximum rain per minute | 0.00 in. on day 25 at time 23:59 |
Maximum temperature | 58.5�F on day 25 at time 16:44 |
Minimum temperature | 52.8�F on day 25 at time 23:25 |
Maximum humidity | 78% on day 25 at time 14:15 |
Minimum humidity | 60% on day 25 at time 17:12 |
Maximum pressure | 29.928 in. on day 25 at time 14:14 |
Minimum pressure | 29.865 in. on day 25 at time 04:44 |
Maximum windspeed | 10.4 mph on day 25 at time 13:29 |
Maximum gust speed | 13.8 mph from 269 �( W ) on day 25 at time 13:28 |
Maximum heat index | 58.5�F on day 25 at time 16:44 |
Click here to toggle the 24 Hour Graph of this day
Apr 26 Average and Extremes |
Average temperature | 53.8�F |
Average humidity | 75% |
Average dewpoint | 45.9�F |
Average barometer | 29.9 in. |
Average windspeed | 3.1 mph |
Average gustspeed | 4.9 mph |
Average direction | 269� ( W ) |
Rainfall for month | 0.14 in. |
Rainfall for year | 9.81 in. |
Maximum rain per minute | 0.00 in. on day 26 at time 23:59 |
Maximum temperature | 61.2�F on day 26 at time 14:49 |
Minimum temperature | 46.4�F on day 26 at time 06:21 |
Maximum humidity | 85% on day 26 at time 07:16 |
Minimum humidity | 60% on day 26 at time 11:41 |
Maximum pressure | 29.905 in. on day 26 at time 23:29 |
Minimum pressure | 29.824 in. on day 26 at time 05:44 |
Maximum windspeed | 13.8 mph on day 26 at time 17:16 |
Maximum gust speed | 19.6 mph from 290 �(WNW) on day 26 at time 17:15 |
Maximum heat index | 61.2�F on day 26 at time 14:49 |
Click here to toggle the 24 Hour Graph of this day
Apr 27 Average and Extremes |
Average temperature | 54.9�F |
Average humidity | 78% |
Average dewpoint | 48.1�F |
Average barometer | 30.0 in. |
Average windspeed | 3.5 mph |
Average gustspeed | 5.6 mph |
Average direction | 250� (WSW) |
Rainfall for month | 0.16 in. |
Rainfall for year | 9.83 in. |
Maximum rain per minute | 0.01 in. on day 27 at time 08:30 |
Maximum temperature | 59.8�F on day 27 at time 17:34 |
Minimum temperature | 52.0�F on day 27 at time 01:44 |
Maximum humidity | 88% on day 27 at time 01:38 |
Minimum humidity | 66% on day 27 at time 15:41 |
Maximum pressure | 30.097 in. on day 27 at time 23:44 |
Minimum pressure | 29.890 in. on day 27 at time 02:59 |
Maximum windspeed | 10.4 mph on day 27 at time 11:44 |
Maximum gust speed | 15.0 mph from 219 �( SW) on day 27 at time 18:34 |
Maximum heat index | 59.8�F on day 27 at time 17:34 |
Click here to toggle the 24 Hour Graph of this day
Apr 28 Average and Extremes |
Average temperature | 56.5�F |
Average humidity | 76% |
Average dewpoint | 48.9�F |
Average barometer | 30.1 in. |
Average windspeed | 2.8 mph |
Average gustspeed | 4.6 mph |
Average direction | 266� ( W ) |
Rainfall for month | 0.16 in. |
Rainfall for year | 9.83 in. |
Maximum rain per minute | 0.00 in. on day 28 at time 23:59 |
Maximum temperature | 66.5�F on day 28 at time 14:35 |
Minimum temperature | 46.1�F on day 28 at time 06:22 |
Maximum humidity | 92% on day 28 at time 06:29 |
Minimum humidity | 62% on day 28 at time 15:40 |
Maximum pressure | 30.124 in. on day 28 at time 09:14 |
Minimum pressure | 30.032 in. on day 28 at time 19:14 |
Maximum windspeed | 12.7 mph on day 28 at time 16:10 |
Maximum gust speed | 17.3 mph from 271 �( W ) on day 28 at time 16:45 |
Maximum heat index | 66.5�F on day 28 at time 14:35 |
Click here to toggle the 24 Hour Graph of this day
Apr 29 Average and Extremes |
Average temperature | 60.1�F |
Average humidity | 73% |
Average dewpoint | 50.7�F |
Average barometer | 30.0 in. |
Average windspeed | 2.4 mph |
Average gustspeed | 4.0 mph |
Average direction | 266� ( W ) |
Rainfall for month | 0.16 in. |
Rainfall for year | 9.83 in. |
Maximum rain per minute | 0.00 in. on day 29 at time 23:59 |
Maximum temperature | 75.4�F on day 29 at time 15:08 |
Minimum temperature | 47.5�F on day 29 at time 06:35 |
Maximum humidity | 91% on day 29 at time 06:02 |
Minimum humidity | 48% on day 29 at time 15:00 |
Maximum pressure | 30.080 in. on day 29 at time 00:00 |
Minimum pressure | 29.936 in. on day 29 at time 18:14 |
Maximum windspeed | 11.5 mph on day 29 at time 16:22 |
Maximum gust speed | 15.0 mph from 284 �(WNW) on day 29 at time 16:21 |
Maximum heat index | 77.8�F on day 29 at time 15:08 |
Click here to toggle the 24 Hour Graph of this day
Apr 30 Average and Extremes |
Average temperature | 60.6�F |
Average humidity | 75% |
Average dewpoint | 52.2�F |
Average barometer | 29.9 in. |
Average windspeed | 2.4 mph |
Average gustspeed | 4.2 mph |
Average direction | 266� ( W ) |
Rainfall for month | 0.16 in. |
Rainfall for year | 9.83 in. |
Maximum rain per minute | 0.00 in. on day 30 at time 23:59 |
Maximum temperature | 71.7�F on day 30 at time 15:35 |
Minimum temperature | 53.3�F on day 30 at time 04:39 |
Maximum humidity | 86% on day 30 at time 06:44 |
Minimum humidity | 59% on day 30 at time 17:02 |
Maximum pressure | 29.949 in. on day 30 at time 00:00 |
Minimum pressure | 29.847 in. on day 30 at time 18:59 |
Maximum windspeed | 11.5 mph on day 30 at time 17:24 |
Maximum gust speed | 17.3 mph from 277 �( W ) on day 30 at time 16:58 |
Maximum heat index | 76.2�F on day 30 at time 15:33 |
Click here to toggle the 24 Hour Graph of this day
Average and Extremes for Month of April 2025 up to day 30 |
Average temperature | 57.6�F |
Average humidity | 73% |
Average dewpoint | 48.7�F |
Average barometer | 29.988 in. |
Average windspeed | 3.5 mph |
Average gustspeed | 5.6 mph |
Average direction | 262� ( W ) |
Rainfall for month | 0.16 in. |
Rainfall for year | 9.67 in. |
Maximum rain per minute | 0.02 in on day 01 at time 09:22 |
Maximum temperature | 78.2�F on day 13 at time 16:51 |
Minimum temperature | 43.3�F on day 02 at time 07:18 |
Maximum humidity | 92% on day 28 at time 06:29 |
Minimum humidity | 28% on day 06 at time 17:25 |
Maximum pressure | 30.25 in. on day 05 at time 10:59 |
Minimum pressure | 29.82 in. on day 26 at time 05:44 |
Maximum windspeed | 17.3 mph from 259�( W ) on day 01 at time 17:47 |
Maximum gust speed | 26.5 mph from 270�( W ) on day 01 at time 16:40 |
Maximum heat index | 78.6�F on day 13 at time 16:50 |
Growing degrees days | 308.1 GDD |
Day, Sunshine Hours, ET, Max Solar, UV |
01 02:18hrs |
ET :0.10 in. |
1120.0 W/m� |
4.5 uv |
02 08:54hrs |
ET :0.13 in. |
902.0 W/m� |
4.5 uv |
03 08:54hrs |
ET :0.13 in. |
898.0 W/m� |
4.5 uv |
04 08:42hrs |
ET :0.17 in. |
898.0 W/m� |
4.9 uv |
05 08:18hrs |
ET :0.17 in. |
984.0 W/m� |
5.4 uv |
06 06:30hrs |
ET :0.16 in. |
1007.0 W/m� |
5.4 uv |
07 02:36hrs |
ET :0.11 in. |
1007.0 W/m� |
5.4 uv |
08 07:42hrs |
ET :0.14 in. |
888.0 W/m� |
5.7 uv |
09 09:00hrs |
ET :0.15 in. |
902.0 W/m� |
5.7 uv |
10 07:18hrs |
ET :0.15 in. |
1079.0 W/m� |
6.1 uv |
11 07:54hrs |
ET :0.17 in. |
1007.0 W/m� |
6.3 uv |
12 09:18hrs |
ET :0.18 in. |
928.0 W/m� |
5.2 uv |
13 09:18hrs |
ET :0.18 in. |
916.0 W/m� |
5.2 uv |
14 09:42hrs |
ET :0.16 in. |
919.0 W/m� |
5.5 uv |
15 02:18hrs |
ET :0.13 in. |
1127.0 W/m� |
5.8 uv |
16 07:06hrs |
ET :0.15 in. |
935.0 W/m� |
5.2 uv |
17 01:42hrs |
ET :0.10 in. |
592.0 W/m� |
2.5 uv |
18 04:12hrs |
ET :0.15 in. |
1072.0 W/m� |
6.0 uv |
19 05:30hrs |
ET :0.14 in. |
1220.0 W/m� |
5.9 uv |
20 09:18hrs |
ET :0.16 in. |
937.0 W/m� |
5.7 uv |
21 09:36hrs |
ET :0.16 in. |
939.0 W/m� |
5.7 uv |
22 08:00hrs |
ET :0.15 in. |
984.0 W/m� |
5.7 uv |
23 04:48hrs |
ET :0.14 in. |
1099.0 W/m� |
5.9 uv |
24 00:12hrs |
ET :0.08 in. |
316.0 W/m� |
1.9 uv |
25 00:54hrs |
ET :0.09 in. |
555.0 W/m� |
4.6 uv |
26 03:12hrs |
ET :0.11 in. |
1042.0 W/m� |
4.9 uv |
27 00:42hrs |
ET :0.09 in. |
779.0 W/m� |
3.8 uv |
28 09:42hrs |
ET :0.14 in. |
944.0 W/m� |
5.9 uv |
29 09:42hrs |
ET :0.18 in. |
951.0 W/m� |
6.1 uv |
30 09:30hrs |
ET :0.19 in. |
926.0 W/m� |
5.7 uv |
Sunshine hours month to date 192:47 hrs |
Sunshine hours year to date 661:23 hrs |
Daily Rain Totals |
00.14 in. on day 1 |
00.02 in. on day 27 |